sphinx_ipypublish_all.extToggle Input Cells
Toggle Output Cells
2. Writing Code and Formatting Output
IPyPublish utilises metadata to mark-up the notebook with information on how output should be represented in the converted notebook, as shown in Fig. 2.1.
[1]:
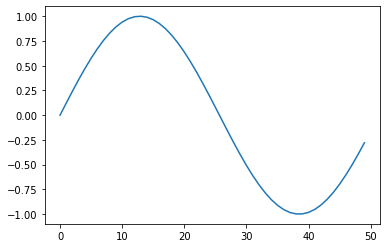
%matplotlib inline
import matplotlib.pyplot as plt
import numpy as np
plt.plot(np.sin(np.linspace(0, 6)))
plt.show()
Matplotlib is building the font cache; this may take a moment.
See also
The PDF representation of this notebook
Metadata Tags, for a full description and list of ipypublish metadata
2.1. Converting Notebooks to Pure Python
To write code, we can work in the conventional Jupyter Notebook environment, or we can use jupytext, to convert between a notebook and the pure python percent format
$ jupytext --to py:percent notebook.ipynb
$ jupytext --to notebook notebook.py            # overwrite notebook.ipynb
$ jupytext --to notebook --update notebook.py   # update notebook.ipynb
This will produce a standard python file, with commented notebook level
metadata commented at the top (in YAML format), and each cell beginning
with #%% (known as the percent format):
The percent format can be utilised in IDEs, such as Spyder, Atom, PyCharm, and VS Code, to run individual cells:
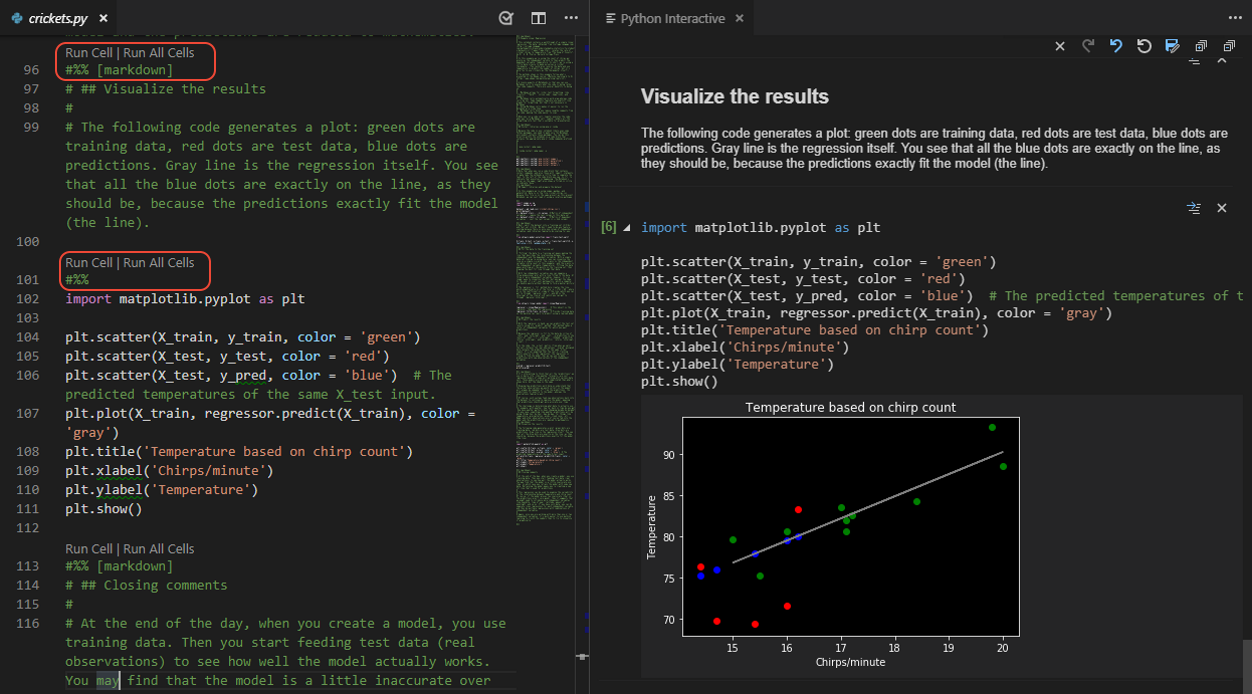
Fig. 2.1.1 Running Notebooks in VS Code
Important
To preserve ipypublish notebook metadata, you must
add:
"jupytext": {"metadata_filter": {"notebook": "ipub"}}
to
your notebooks metadata before conversion.
2.2. NB Setup Helper Functions
ipypublish.scripts.nb_setup offers a number of useful
functions, to setup common packages (matplotlib, pandas, etc) for
outputting content in high quality formats.
[2]:
from ipypublish import nb_setup
Note
ipypublish.scripts.ipynb_latex_setup is deprecated in v0.9
2.3. Text Output
[3]:
print("""
This is some printed text,
with a nicely formatted output.
""")
This is some printed text,
with a nicely formatted output.
2.4. Images (with PIL)
[4]:
import os
from ipypublish.tests import TEST_PIC_PATH
[5]:
nb_setup.images_hconcat([TEST_PIC_PATH, TEST_PIC_PATH],
               width=600, gap=10)

[6]:
nb_setup.images_vconcat([TEST_PIC_PATH, TEST_PIC_PATH],
               height=400, gap=10)

[7]:
nb_setup.images_gridconcat([[_,_] for _ in [TEST_PIC_PATH, TEST_PIC_PATH]],
               height=300, vgap=10,hgap=20)

2.5. Plots (with Matplotlib)
A matplotlib figure (Fig. 2.5.1), and its code (Code Block 2.5.1).
[8]:
plt = nb_setup.setup_matplotlib(output=('pdf','svg'))
plt.scatter(np.random.rand(10), np.random.rand(10),
            label='data label')
plt.ylabel(r'a y label with latex $\alpha$')
plt.legend();
/home/docs/checkouts/readthedocs.org/user_builds/ipypublish/conda/latest/lib/python3.6/site-packages/ipypublish/scripts/nb_setup.py:226: MatplotlibDeprecationWarning: Support for setting the 'text.latex.preamble' or 'pgf.preamble' rcParam to a list of strings is deprecated since 3.3 and will be removed two minor releases later; set it to a single string instead.
  mpl.rcParams[key] = val
/home/docs/checkouts/readthedocs.org/user_builds/ipypublish/conda/latest/lib/python3.6/site-packages/ipypublish/scripts/nb_setup.py:226: MatplotlibDeprecationWarning:
The text.latex.preview rcparam was deprecated in Matplotlib 3.3 and will be removed two minor releases later.
  mpl.rcParams[key] = val
/home/docs/checkouts/readthedocs.org/user_builds/ipypublish/conda/latest/lib/python3.6/site-packages/ipypublish/scripts/nb_setup.py:226: MatplotlibDeprecationWarning:
The mathtext.fallback_to_cm rcparam was deprecated in Matplotlib 3.3 and will be removed two minor releases later.
  mpl.rcParams[key] = val
/home/docs/checkouts/readthedocs.org/user_builds/ipypublish/conda/latest/lib/python3.6/site-packages/ipypublish/scripts/nb_setup.py:226: MatplotlibDeprecationWarning: Support for setting the 'mathtext.fallback_to_cm' rcParam is deprecated since 3.3 and will be removed two minor releases later; use 'mathtext.fallback : 'cm' instead.
  mpl.rcParams[key] = val
/home/docs/checkouts/readthedocs.org/user_builds/ipypublish/conda/latest/lib/python3.6/site-packages/ipypublish/scripts/nb_setup.py:226: MatplotlibDeprecationWarning:
The validate_bool_maybe_none function was deprecated in Matplotlib 3.3 and will be removed two minor releases later.
  mpl.rcParams[key] = val
/home/docs/checkouts/readthedocs.org/user_builds/ipypublish/conda/latest/lib/python3.6/site-packages/ipypublish/scripts/nb_setup.py:226: MatplotlibDeprecationWarning:
The savefig.jpeg_quality rcparam was deprecated in Matplotlib 3.3 and will be removed two minor releases later.
  mpl.rcParams[key] = val
/home/docs/checkouts/readthedocs.org/user_builds/ipypublish/conda/latest/lib/python3.6/site-packages/ipypublish/scripts/nb_setup.py:226: MatplotlibDeprecationWarning:
The animation.html_args rcparam was deprecated in Matplotlib 3.3 and will be removed two minor releases later.
  mpl.rcParams[key] = val
/home/docs/checkouts/readthedocs.org/user_builds/ipypublish/conda/latest/lib/python3.6/site-packages/ipypublish/scripts/nb_setup.py:226: MatplotlibDeprecationWarning:
The animation.avconv_args rcparam was deprecated in Matplotlib 3.3 and will be removed two minor releases later.
  mpl.rcParams[key] = val

Note
If outputting the Matplotlib figures in a PDF format. See usetex tutorial, and Stackoverflow question.
2.6. Tables (with pandas)
A pandas table (Table 2.6.1), and its code (Code Block 2.6.1).
[9]:
pd = nb_setup.setup_pandas(escape_latex=False)
df = pd.DataFrame(np.random.rand(3,4),columns=['a','b','c','d'])
df.a = ['$\delta$','x','y']
df.b = ['l','m','n']
df.set_index(['a','b'])
df.round(3)
[9]:
a |
b |
c |
d |
|
|---|---|---|---|---|
0 |
\(\delta\) |
l |
0.117 |
0.875 |
1 |
x |
m |
0.186 |
0.578 |
2 |
y |
n |
0.992 |
0.992 |
Note
If using escape_latex=False, then PDF conversion will throw an
error
if there are e.g. _’s in your column names. You either
need to escape
these manually (\_) or use escape_latex=True.
But note that,
escape_latex=True will also escape math
(e.g. $\delta$) causing it not
to render.
2.7. Equations (with ipython or sympy)
An ipython and sympy equation Eq. 2.7.1 and Eq. 2.7.2.
[10]:
from IPython.display import Latex
Latex('$$ a = b+c $$')
[10]:
[11]:
sym = nb_setup.setup_sympy()
f = sym.Function('f')
y = sym.Function('y')
n = sym.symbols(r'\alpha')
f = y(n)-2*y(n-1/sym.pi)-5*y(n-2)
sym.rsolve(f,y(n),[1,4])
[11]:
2.8. IPywidgets
ipywidgets can be
added to the notebook, to create interactive elements. These widgets are
preserved in sphinx HTML outputs.
[12]:
import ipywidgets
slider1 = ipywidgets.FloatSlider()
slider1.description = "Slide Me"
slider1
Multiple views of the same widget can be created:
[13]:
slider1
Using jslink, widgets can also be synced, without the need for an
active python kernel:
[14]:
slider2 = ipywidgets.BoundedFloatText()
link = ipywidgets.jslink(
    (slider1, 'value'),
    (slider2, 'value'))
slider2
For more complex examples see: jupyter.org/widgets
2.9. Object Output Formats
The format of the Jupyter Notebook file allows for the storage of a single output in multiple formats. This is taken advantage of by packages such as matplotlib and pandas, etc to store a figure/table in both latex and html formats, which can then be selected by ipypublish based on the document type required.
Sometimes a user may wish to have greater control over the output format
and/or which output types are to be stored. It it possible to achieve
this via the Jupyter display function. For example, if we wanted
to display a pandas.DataFrame table without the index column, such that
it can be output to both a pdf and html document:
[15]:
from IPython.display import display
df = pd.DataFrame(np.random.random((3, 3)))
latex = df.to_latex(index=False)
html = df.to_html(index=False)
display({'text/latex': latex,
        'text/html': html}, raw=True)
0 |
1 |
2 |
|---|---|---|
0.807925 |
0.733988 |
0.803516 |
0.636501 |
0.885510 |
0.340308 |
0.259823 |
0.665477 |
0.687906 |
If you wish to create your own object with multiple output formats, you
should create a class with multiple _repr_*_() methods:
[16]:
class MyObject(object):
    def __init__(self, text):
        self.text = text

    def _repr_latex_(self):
        return "\\textbf{LaTex: " + self.text + "}"

    def _repr_html_(self):
        return "<b>HTML: " + self.text + "</b>"

MyObject('hallo')
[16]:
2.10. Multiple Outputs from a Single Code Cell
Similarly, with the Jupyter display functionality, you can control
the output metadata for multiple outputs in a single code cell:
[17]:
from IPython.display import display
from IPython.display import display_latex
from IPython.display import display_markdown

x = np.linspace(0, 3.42)

for i in range(1,3):

    display_markdown(
      '### Code Created Heading {0}'.format(i), raw=True)

    fig, ax = plt.subplots()
    ax.plot(x, np.sin(x*i))
    metadata={'ipub': {
      'figure': {
        'caption': 'Code Created Heading {0}'.format(i)}}}
    display(fig, metadata=metadata)
    plt.close()

